Kabir Wealth Code: The combined effect of emotional awareness (EA) and intelligence quotient (IQ)
Abstract: Background: Intelligence quotient (IQ) is a measure of intellectual…
COVID-19 cost almost 700,000 (seven hundred thousand) deaths in the Unites States and low vaccination rates are widely seen as undermining individual and community protection. The objective of the study was to evaluate the risk factors associated with lower COVID-19 vaccination rates in the United States. The study evaluated the effect of red-blue political affiliation, and the effect of the US state’s average educational aptitude scores and per capita income on states vaccination rates. The study found that states with concomitantly lower income along with lower educational aptitude scores are less vaccinated while the states with higher income have higher vaccination rates even among those with lower educational aptitude scores. These findings stayed significant after adjusting for red-blue political affiliation where states with red political affiliation have lower vaccination rates. Further study is needed to evaluate how to stop online misinformation among states with low income and low educational aptitude scores; and whether such an effort will increase overall vaccination rates in the United States.
Online misinformation surrounding the COVID-19 vaccine is the major obstacle in fighting the coronavirus pandemic. Loomba et al. conducted randomized controlled trials in the UK and the USA, showing how exposure to online misinformation around COVID-19 vaccines affects intent to vaccinate to protect oneself or others. [1] The study found that some sociodemographic groups are differentially impacted by exposure to misinformation than others, and scientific-sounding misinformation was found more strongly associated with declines in vaccination intent. Policymakers are struggling to stop online misinformation while the COVID-19 pandemic is taking thousands of lives worldwide.
In the setting of highly transmissible and fatal COVID-19 pandemics, vaccination hesitancy is widely seen as undermining individual and community protection. Despite United States have adequate vaccine available for its population, the vaccination rate in the US facing multiple challenges. During pre-COVID-19 era research, the lower vaccination rates were considered resulting from a complex decision-making process that reported as “3 Cs” model, which highlights complacency, convenience, and confidence [2]. Another research done in 2012 shown that acceptance of vaccination can be also potentially influenced by cultural, and religious roots. [3]. Though multiple prior study found that certain socio-demographic groups are more vulnerable to remain unvaccinated, no prior study looked at average state educational aptitude score and per capita income as well as political affiliation as risk factors for lower vaccination rates.
The US State’s average educational aptitude scores were extrapolated from the McDaniel study published in 2006 [4]. McDaniel estimated intelligence quotient (educational aptitude score) from the National Assessment of Educational Progress (NAEP) standardized tests for reading and math (administered to a sample of public-school children in each of the 50 states). The means of the standardized reading scores for grades 4 and 8 were averaged across years as well as the means of the standardized math scores for all 50 US states. The author offered two causal models that predicted state educational aptitude score (or states Intelligence quotient) which was estimated from the average of mean reading and mean math scores. These models explained 83% and 89% of the variability of state educational aptitude score. And the estimated educational aptitude scores showed positive correlations with gross state product, health, and government effectiveness and negative correlations with violent crime [4].
The US vaccination data were obtained from the NPR website as of the 15th of July 2021 [5]. The State level per capita income for the year 2010 to 2014 was collected from the U.S. Census Bureau data [6]. The 50 US States 2020 presidential elections results data (red-blue political affiliation) were collected from the Politico website election result map [7]. The red political affiliation was coded as zero and blue political affiliation was coded as 1 for the purpose of the study.
All these five data sets were merged using Python data analysis software. In addition, educational aptitude score, per capita income, and state vaccination rates were ranked to demonstrate trends in the scatter plot. The US States were ranked 1 to 50 based on the average educational aptitude score, where rank number 1 was the highest educational aptitude score and 50 being the lowest. The US vaccination data were ranked from 1 to 50 where rank number 1 was the highest fully vaccinated state and 50th being the lowest. The State level per capita income was ranked from 1 to 50 as well where rank number 1 was the highest per capita income and 50 being the lowest. Pearson’s correlation coefficients were obtained for all the independent variables where two-sided T test were considered significant at 0.05. The multivariate linear regression analysis was conducted using the states vaccination rate as dependent variable and state educational aptitude, average per capita income and red-blue political affiliation as independent variable, A forward selection method was considered to determine the final regression model. The statistical data analysis software Stata was used.
A total of fifty (50) US states were considered in the data analysis. The average US full vaccination rate was 47.5% (±8.5) by July 15th, 2021), the average US population educational aptitude score was 100 (±2.71), and the average per capita income was $28,889.
Table 1 shows state’s per capita income and income rank are strongly correlated with percent fully vaccinated with correlation coefficients 0.69 and -0.71, respectively. This indicates states average income has a parallel relationship to state’s vaccination rates which means vaccination rates increase with increase of income. Again, states educational aptitude rank and average educational aptitude score were also significantly correlated with percent fully vaccinated with correlation coefficients of 0.45 and -0.47, respectively. This indicates the educational aptitude score has a parallel relationship with vaccination rates which means vaccination increases with the increase of educational aptitude score. The correlation coefficient between state educational aptitude and per capita income rank was highly significant at 0.56 (P <0.001). The correlation between red-blue affiliation and educational aptitude score were statistically not significant (p>0.05) but red-blue affiliation was highly correlated with state vaccination rates and state per capita income with correlation coefficient of 0.77 and 0.59, respectively (P <0.001).
Table 1: Correlation matrix of the variables used in the analysis: Demonstrating effect of population average Educational Aptitude (EA) score and per capita income on percent fully vaccinated.
| Vaccination Rank | % Fully Vaccinated | EA Rank | Average EA | Income Rank | Per capita Income | Red-blue Affiliation | |
| Vaccination Rank | 1 | ||||||
| % Fully Vaccinated | -0.99 <0.001 | 1 | |||||
| Educational Aptitude (EA) Rank | 0.45 <0.001 | -0.47 <0.001 | 1 | ||||
| Average EA | -0.44 <0.002 | 0.45 <0.001 | -0.98 <0.001 | 1 | |||
| Income Rank | -0.72 <0.001 | -0.71 <0.001 | 0.56 <0.001 | -0.55 <0.001 | 1 | ||
| Per Capita Income | -0.71 <0.001 | 0.69 <0.001 | -0.52 <0.001 | 0.52 <0.001 | -0.97 <0.001 | 1 | |
| Red-blue Political Affiliation | -0.78 <0.001 | 0.77 <0.001 | -0.18 <0.21 | 0.16 <0.26 | -0.60 <0.001 | 0.59 <0.001 | 1 |
Figure 1 demonstrates there is a decreasing trend of states’ populations who are fully vaccinated among populations with lower educational aptitude score. These lower vaccination rates can be an indication of accepting online misinformation about vaccination among the state with low educational aptitude score. The association has an R square value of 22.48% which means 22.5% variability of the vaccination is explained by the state population educational aptitude score.
Fig 1: Scatter plot of percentage of the US states total population fully vaccinated by state rank of educational aptitude scores
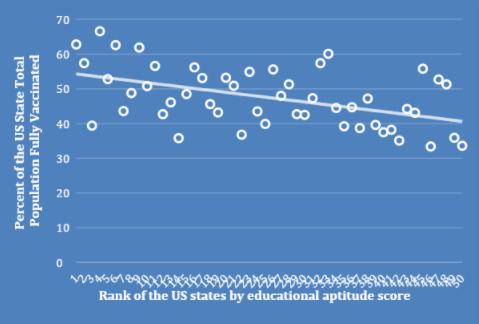
Figure 2 demonstrates there is a decreasing trend of population vaccination rates among the US states among lower-income populations. These lower vaccination rates can be an indication of accepting online misinformation about vaccination among low-income populations. This association has an R square value of 49.9% which means 49.9% variability of the vaccination is explained by income.
Fig 2: Scatter plot of percentage of the US states total population fully vaccinated by state’s rank of per capita income.
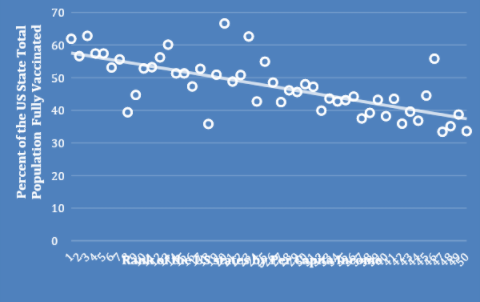
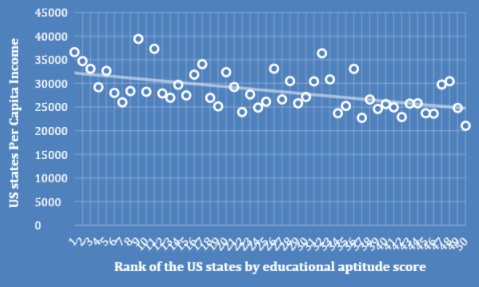
Figure 3 demonstrates there is a decreasing trend of per capita income among populations with lower educational aptitude score. Previous studies also reported national wealth strongly correlates with its population average educational aptitude scores [6]. According to the current study, the population educational aptitude score explains 28.1% of the variability of the population income.
Fig 3: Scatter plot the US states per capita income by state rank of educational aptitude scores
A multivariate analysis of the state’s percent vaccination was conducted using the independent effect of educational aptitude score, per capita income, interaction effect of average educational aptitude score and per capita income and red-blue affiliation as predictor variables (Table 2). When the effect of average educational aptitude score and per capita income was entered in the model, all variables were non-significant. But when the main effect of average educational aptitude score and per capita income were removed from the model, the cross-over interaction effect of average educational aptitude score and per capita income and red-blue affiliation were found strongly significant. The R square for the final model was 0.70 indicating 70% variability of vaccination was explained by these predictors. This means the effect of per capita income on the vaccination rate is opposite depending on the value of educational aptitude score. These findings were further explained in Table 3. The linear regression model R square value with only the cross-over interaction effect of average educational aptitude score and per capita income was 0.49 indicating the red-blue political affiliation explaining 21% (R square = 0.21) variability of the final model.
Table 2: Regression analysis demonstrating the effect of the product of educational aptitude scores and per capita income on percent fully vaccinated (R square = 0.70).
| Variables | Beta Coefficient | Standard Error | Lower Limit | Upper Limit | P-value |
| Product of education aptitude score and per capita Income | 0.71 | 0.18 | 0.35 | 1.06 | <0.001 |
| Red-blue Political Affiliation | 9.39 | 1.63 | 6.01 | 12.58 | <0.001 |
| Constant | 22.79 | 4.69 | 13.35 | 32.24 | <0.001 |
Given that this study found a significant cross over interaction effect (opposite effect) of average educational aptitude score and per-capita income while predicting percent fully vaccinated, the quartiles of the educational aptitude score and income were sorted by percent fully vaccinated in Table 3. The study findings show a 38.8% vaccination rate among lowest income quartiles with lowest educational aptitude score group but among the highest income quartiles with highest educational aptitude score the vaccination rates remain highest which was 55.2%. Such a cross over interaction effect showing opposite effects of educational aptitude score and income on vaccination rates is a very intriguing and unique finding and will be very interesting research topics for state policy makers. This study finding demonstrates that states with a concomitantly lower income and lower educational aptitude score are the most vulnerable and accepting online misinformation regarding COVID-19 vaccination.
Table 3: Demonstrating percentage of full vaccination by quartiles of educational aptitude (EA) scores and income
| Quartiles | EA Quartile 1>102.8 | EA Quartile 2(100.85 – 102.8) | EA Quartile 3(102.8 – 98.6) | EA Quartile 4(< 98.6) | Total |
| Income Quartile 1(>$30,830) | 55.2% (±8.5)n=6 | 54.2% (±1.8)n=3 | 54.5% (±6.8)n=4 | n=0 | 54.7% (±6.5)n=13 |
| Income Quartile 2($27,546 – $30,830) | 54.3% (±10.0)n=5 | 47.2% (±10.1)n=3 | 49.3% (±2.8)n=2 | 52% (±1.0)n=2 | 51.3% (±8.1)n=12 |
| Income Quartile 3($25,229 – $27,546) | 44.9% (±1.8)n=2 | 44.7% (±4.4)n=3 | 43.1% (±3.6)n=4 | 43.0% (±4.1)n=4 | 43.7% (±3.4)n=13 |
| Income Quartile 4(<$25,229) | n=0 | 41.2% (±3.8)n=3 | 41.6% (±4.1)n=2 | 38.8% (±7.8)n=7 | 39.9% (±6.3)n=12 |
| Total | 53.2% (±8.8)n=13 | 46.8% (±7.1)n=12 | 47.7% (±7.1)n=12 | 42.1% (±7.6)n=13 | 47.5% (±8.5)n=50 |
The COVID-19 cost almost 700,000 (seven hundred thousand) lives in the United States and death rates are very high among the unvaccinated in the United States. The US states that have concomitantly lowest educational aptitude score along with lowest per capita income have the lowest vaccination rates of 38.8% as of July 15th, 2021. The average US fully vaccination rates were 47.5% at that time. The crossover interaction effect of income and educational aptitude score remains significant even after adjusting for red-blue political affiliation where red political affiliations have significantly lower vaccination rates compared to those of blue political affiliations.
Online misinformation about COVID-19 vaccination possibly led to lower vaccination rates among many US states. Prior research on misinformation was related to the context of the 2016 US presidential election [8,9]. The current study found lower vaccination rates possibly related to accepting misinformation among the red politically affiliated US states. There is a strong cross over interaction effect of low income and low educational aptitude score indicating states with the lowest income quartiles have lowest vaccination rates (i.e., most affected with online misinformation about COVID-19 vaccination) if they have the lowest educational aptitude score. The study also found the state population with the highest income quartiles does not get affected by online misinformation even when those have a lower educational aptitude score. This is a unique cross over interaction effect and no other study reported similar findings in the past.
The study also found during univariate analysis that income explains almost 50% of the vaccination variability with states with lower income trends to be less vaccinated. Another univariate analysis showed the states with lower educational aptitude scores are less likely to be vaccinated compared to those with high educational aptitude score and educational aptitude score explain 23% of the vaccination variability. Similarly, the red-blue political affiliation explains 21% variability in the final multivariate model while the final multivariate model explains 70% variability of the United States vaccination rates.
It is possible that even if certain individuals within the same state have a high educational aptitude score, they may be vulnerable to misinformation as traditionally such misinformation propagates through their friends, families, and acquaintances in society. Roozenbeek et al. reported that higher trust in scientists and higher numeracy skills (which is the ability to use, interpret and communicate mathematical data, maybe equivalent to educational aptitude score) were associated with lower susceptibility to COVID-19 related misinformation. The study demonstrated a clear link between susceptibility to misinformation and vaccine hesitancy and suggests interventions aiming to improve critical thinking and trust in science may be a promising avenue for future research [10]. It is possible that the socio-demographic group with lower educational aptitude score and income fails to interpret scientific data themself and depends on their trusted news source to understand scientific or mathematical data. This may lead to acceptance of online misinformation leading to lower vaccinations among the population with low income along with low educational aptitude groups in the United States.
The current study used state’s average data instead of individual data to find predictors of reduced vaccinations. The only study conducted to estimate states educational aptitude was McDaniel study which was done in the year 2006 [4]. This study assumed the average educational aptitude rank stayed same over last decades. Moreover, McDaniel study calculated a surrogate measures of states intelligence quotient even though the author used average of mean reading and mean math scores. It is possible that certain geo-political or state population data reflects a more accurate picture than individual data given that misinformation needs a society or group-level enabler for the misinformation to propagate across the state.
Conclusion: The states with concomitantly lower income and lower educational aptitude scores have lower vaccination rates after adjusting for red-blue political affiliation. The study also found that states with red political affiliation have significantly lower vaccination rates. Further study is needed to evaluate how to stop online misinformation among states with lowest income and lowest educational aptitude score and whether such an effort will increase overall vaccination rates in the United States.
Conflict of Interest: The author has no conflict of interest to disclose.
Author: Azad Kabir, MD MSPH; Raeed Kabir; Jebun Nahar, PhD; Ritesh Sengar;
Affiliations: Doctor Ai, LLC; 1120 Beach Blvd, Biloxi; MS 39530 Corresponding author’s name and contact information (e-mail address, mailing address, phone number): Azad Kabir, MD, MSPH, ABIM; Doctor Ai, LLC; 1120 Beach Blvd, Biloxi; MS 39530; Email: azad.kabir@gmail.com; Cell: 228-342-6278
Discussion about this post